
Are you someone who is trying to fundraise? You may want to know about some statistics in the industry before running any campaign. Let’s take a look at some of the general statistics and trends for fundraising and crowdfunding.
First, let’s define what fundraising and crowdfunding are. In this instance of this article, it’s referring to those who are raising funds online for either charity, donation, or for-profit companies. Backers can be awarded rewards such as physical or digital items, or equity in the company, which can be done through equity crowdfunding efforts. So let’s dive in.
How much money is raised through crowdfunding efforts yearly?
There is about $17.2 billion raised per year in North America. 22.4% is the average success rate of crowdfunding campaigns. Fully funded crowdfunding projects have an average of 300 backers. This should give you an idea of how much money you can expect to raise, with the amount of backers that would normally be needed. However, all crowdfunding campaigns are unique, so you may need to determine what your campaign will need in specific.
How much is online giving growing?
Giving/donating online is growing year over year by 20.7%. And among the different types of fundraising options, small nonprofits raising less than $1M have seen the most significant growth in online giving. This is great news for those that may be running smaller charitable campaigns as the support for such actions is growing.
What’s the best social media platform for raising funds?
Twitter posts have an average engagement rate of 1.8% whereas Facebook posts have an average engagement rate of 0.32%. This is something to consider when using different social media platforms for your crowdfunding or fundraising campaigns.
Understanding email stats
$78 can be raised for every 1,000 messages/emails sent to potential backers. Much like the growth seen in online giving, the email lists for fundraising increased by 3% in 2020.
When is the giving season?
Taking a look at last year’s giving distribution by month chart (see below), you can see that people are giving the most in December.
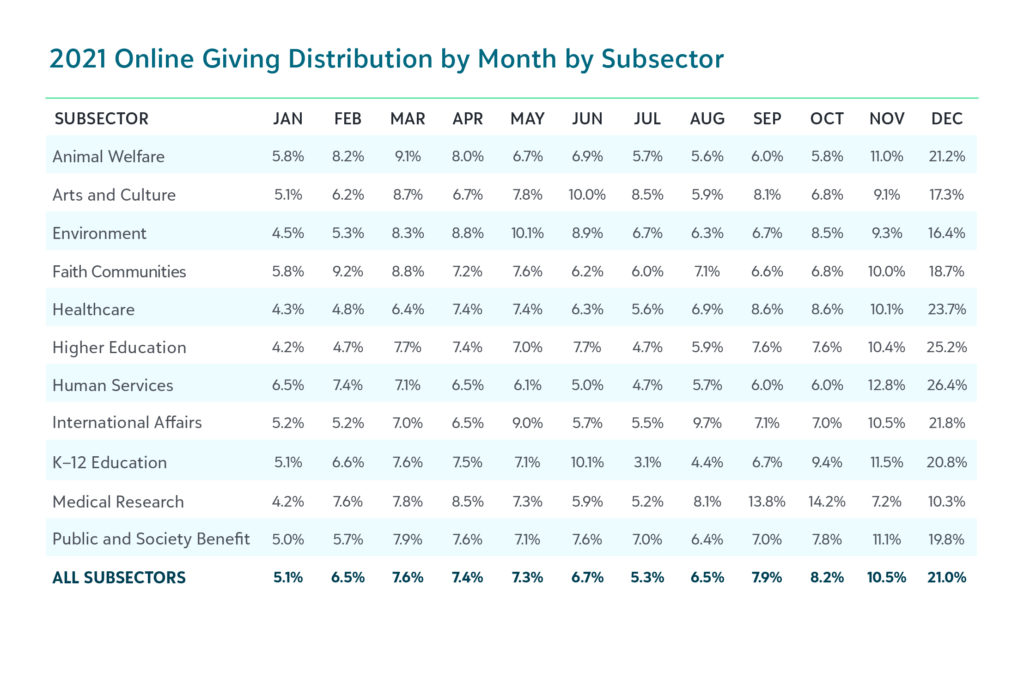
As per the above, the last three months incur the highest percent of the distribution. So Oct, Nov, and Dec are great times for those that want to create charitable fundraising campaigns.
Signs of a growing industry
From the stats explained above, we can see that more people, year over year, are backing campaigns whether they are supporting donations or rewards-based campaigns, there are more people than the previous year making such purchases online. This is a good sign that it’s a growing industry.
Crowdfunding specific stats
It’s projected that in 2023 there will be roughly 12,000,000 crowdfunding campaigns. That would be more than double the amount that was created in 2021.
Hopefully, these stats provided you with a greater picture of fundraising online and the potential of this industry for your own benefit. Anyone can create crowdfunding campaigns, but understanding the right time and where to place your marketing efforts can help with the success of your campaign.
Below are some of the resources used for the stats as mentioned in this article.
Resources: